Anesthesia physiology forms the cornerstone of daily clinical practice and postgraduate exam preparation, particularly for board examinations like the EDAIC Part 1. Understanding how gas transport and cardiac mechanics function under anesthesia requires a firm grasp of two high-yield topics: the oxyhemoglobin dissociation curve and left ventricular pressure volume loops. This comprehensive guide breaks down the essential mechanisms, clinical $P_{50}$ values, and hemodynamic curve shifts so you can master core basic sciences with complete confidence.
Anesthesia Physiology: The Oxyhemoglobin Dissociation Curve (ODC)
Table of Contents
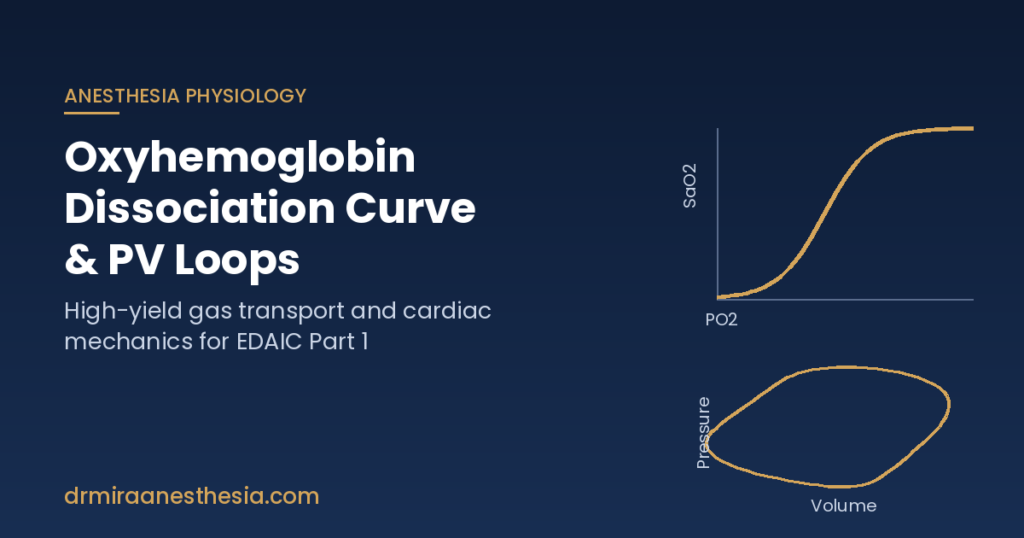
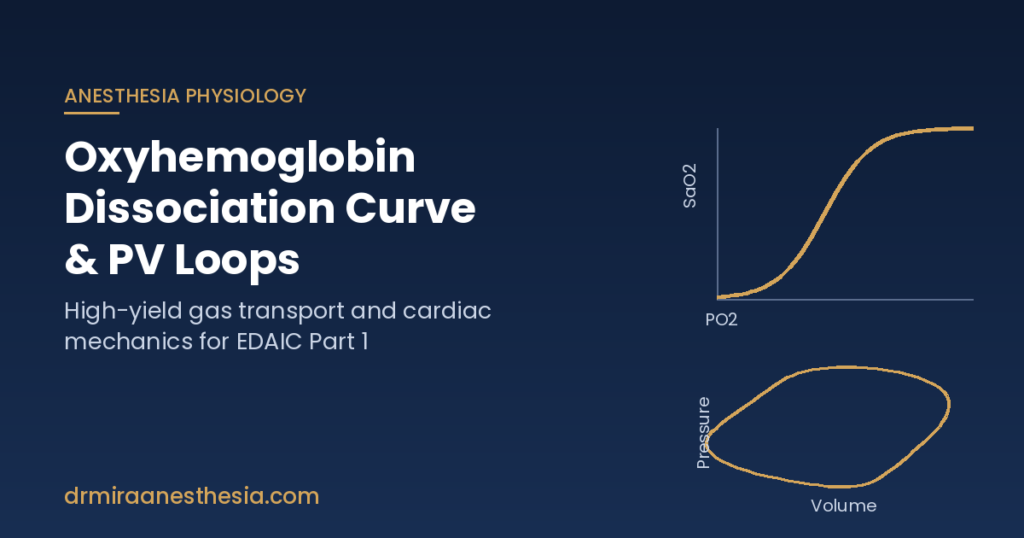
The oxyhemoglobin dissociation curve illustrates the relationship between the partial pressure of arterial oxygen ($\text{PaO}_2$) and the percentage of hemoglobin saturation ($\text{SaO}_2$).
Key Characteristics of the Curve
- Sigmoidal Shape: The curve is S-shaped due to cooperative binding—as each oxygen molecule binds to one of hemoglobin’s four subunits, it increases the affinity of the remaining subunits for oxygen.
- The Loading Zone (Flat Upper Portion): Occurs at $\text{PaO}_2$ levels above $60\text{ mmHg}$ ($\text{SaO}_2 > 90\%$). Large drops in $\text{PaO}_2$ in this range result in minimal drops in saturation, serving as a protective buffer in lungs.
- The Unloading Zone (Steep Middle Portion): Occurs between $\text{PaO}_2$ levels of $20\text{–}50\text{ mmHg}$. Small drops in oxygen tension lead to substantial release of oxygen to peripheral tissues.
- $P_{50}$ Value: The partial pressure of oxygen at which hemoglobin is $50\%$ saturated. Normal human adult $P_{50}$ is $26.8\text{ mmHg}$ (or $\approx 27\text{ mmHg}$).
Factors Shifting the Curve
Understanding what shifts the curve is vital for managing tissue oxygenation during general anesthesia and critical care.
1. Shift to the Right (Decreased Affinity / Increased Unloading)
A rightward shift means hemoglobin has a lower affinity for oxygen, releasing oxygen more readily to metabolic tissues. This increases the $P_{50}$.
- $\uparrow$ Carbon Dioxide ($\text{PaCO}_2$) (The Bohr Effect)
- $\uparrow$ Hydrogen ion concentration ($\downarrow$ pH / Acidosis)
- $\uparrow$ Temperature (Hyperthermia)
- $\uparrow$ 2,3-Diphosphoglycerate (2,3-DPG) (Chronic hypoxia, altitude, anemia)
2. Shift to the Left (Increased Affinity / Decreased Unloading)
A leftward shift means hemoglobin holds onto oxygen tightly, decreasing tissue oxygen delivery. This decreases the $P_{50}$.
- $\downarrow$ Carbon Dioxide ($\text{PaCO}_2$)
- $\downarrow$ Hydrogen ion concentration ($\uparrow$ pH / Alkalosis)
- $\downarrow$ Temperature (Hypothermia)
- $\downarrow$ 2,3-DPG (Banked blood transfusions)
- Presence of Fetal Hemoglobin (HbF), Methemoglobin, or Carboxyhemoglobin
Recommended Anesthesia Textbooks & Study Guides
For comprehensive chapter breakdowns and in-depth physiology diagrams, we recommend reviewing these standard reference texts:
- Morgan and Mikhail’s Clinical Anesthesiology (7th Edition) – The gold-standard core textbook for anesthesia residents and board revision.
- West’s Respiratory Physiology: The Essentials – The definitive guide to respiratory mechanics, ventilation-perfusion ratios, and gas transport.
(Disclaimer: As an Amazon Associate, I earn from qualifying purchases at no extra cost to you.)
Pressure-Volume Loops in Anesthesia Physiology
Pressure-Volume loops offer a real-time framework for evaluating left ventricular mechanics, myocardial contractility, and hemodynamics during intraoperative care.
       Pressure (mmHg)
          ^
     120  |         (2) ESV ---------- (3)
          |          |                  |
          |          |                  |  Isovolumetric
          |          |                  |  Relaxation
          |          |                  |
      10  |         (1) EDV ---------- (4)
          +----------------------------------->
          0         50                 120   Volume (mL)
The 4 Phases of the LV Pressure-Volume Loop
- Phase 1: Isovolumetric Contraction (Points 1 to 2)
- Mitral Valve Closes (Point 1). Left ventricular pressure rises rapidly while volume remains unchanged.
- Phase 2: Ventricular Ejection (Points 2 to 3)
- Aortic Valve Opens (Point 2) when LV pressure exceeds aortic diastolic pressure. Blood is ejected into the aorta until the aortic valve closes (Point 3).
- Phase 3: Isovolumetric Relaxation (Points 3 to 4)
- Aortic Valve Closes (Point 3). LV pressure drops steeply without a change in volume.
- Phase 4: Ventricular Filling (Points 4 to 1)
- Mitral Valve Opens (Point 4) as LV pressure drops below atrial pressure. Blood fills the ventricle until closure occurs at Point 1.
Hemodynamic Alterations on PV Loops
- Increased Preload: Expands the loop to the right (higher End-Diastolic Volume), resulting in an increased Stroke Volume (SV) via the Frank-Starling mechanism.
- Increased Afterload: Increases peak systolic pressure, causes earlier aortic valve closure, and decreases Stroke Volume while raising End-Systolic Volume (ESV).
- Increased Inotropy (Contractility): Shifts the End-Systolic Pressure-Volume Relationship (ESPVR) line to the left, increasing Stroke Volume and ejection fraction while lowering ESV.
High-Yield Summary Checklist for Exams
| Parameter | Shift / Change | Clinical Mechanism |
| Hypothermia | ODC Left Shift | Holds $O_2$ tightly; reduced $P_{50}$ |
| Acidosis / Hypercapnia | ODC Right Shift | Delivers $O_2$ easily; increased $P_{50}$ |
| Banked Blood Transfusion | ODC Left Shift | Depleted 2,3-DPG levels in stored blood |
| Inotropic Support | PV Loop Left Shift | Increased contractility & reduced ESV |
| Volume Resuscitation | PV Loop Right Shift | Increased EDV & increased Stroke volume |